- Turning off all cubicle and office lighting at the close of business each day
- Eliminating electrical usage from desktop computers when not in use
- Implementing staggered climate control daily start-up times and building temperature standards for summer cooling and winter heating
- Installing sun film on sun-exposed windows to reduce glare and hot spots within our facility to lower electricity usage from climate control systems
Green initiatives
Reducing our environmental impact.
Environmental impact tracking and disclosure
Maximus has an important role in contributing efforts to reduce our impact on the environment of the communities in which we live and work.
As a company that primarily provides business process services (BPS) to local, state, federal, and international government, Maximus has a relatively small environmental footprint. However, we remain committed to ensuring responsible environmental practices in each of our communities.

We have invested in technological improvements and solutions to create more efficient and environmentally friendly business practices. Some of our most recent initiatives include:
- Consolidating our data centers, leading to a 50 percent reduction in locations
- Transferring more of our systems onto energy-efficient cloud services
- Implementing new telepresence solutions and collaborative media centers to reduce the necessity of business travel
- Using recycling bins for paper products, plastic bottles, and aluminum cans
- Using recycled paper for mailings and promotional materials whenever possible
- Installing safe and efficient water filtration systems to replace bottled water coolers
- Providing reusable coffee mugs and plastic cups to employees at certain locations
- Supplying biodegradable plates, napkins, and utensils at certain project sites
- Replacing janitorial supplies and paper towels with more eco-friendly products
- Encouraging staff to bring lunch to reduce the use of plastic containers and utensils from local restaurants
We work hand-in-hand with our government clients to recommend ways to reduce paper consumption; this can often be a more cost-effective way to achieve business goals. Ideas our clients have implemented include:
- Replacing traditional paper services with electronic services
- Developing intranet sites to post-program information and reports using electronic "fast alerts" to keep staff abreast of important information
- Encouraging clients to authorize telephone and Web program enrollments as opposed to using and mailing paper enrollments, resulting in a reduced reliance on printed collateral materials and paper products
- Enabling community-based organizations to implement efficient business practices by providing technology and technical assistance to submit program enrollments electronically
- Printing "on demand" and reducing paper use for required mailings
- Initiating a "piggyback" mailing program to add relevant mail to outgoing distribution
Greenhouse Gas Inventory
As a responsible organization whose business activities have a global reach, Maximus has an important role in contributing efforts to reduce our impact on the environment of the communities in which we live and work.
As a company that primarily provides business process services to local, state, federal, and international government, Maximus has a relatively small environmental footprint. However, we remain committed to ensuring responsible environmental practices in each of our communities. This is done through energy reduction efforts, such as energy-saving lighting in our facilities, which provides not only greener solutions but also more cost-effective measures for the Company.
In 2019, Maximus launched an initiative to begin measuring and disclosing our environmental impact, guided by global standardized frameworks such as the Greenhouse Gas (GHG) Protocol, the Carbon Disclosure Project, and the United States Environmental Protection Agency.
Our overall sustainability strategy includes voluntary measures to minimize GHG emissions and energy use, track environmental risks, and improve environmental data collection and visibility. Our strategy is a cross-functional effort working with corporate real estate, corporate responsibility, finance, and operations. Updates are regularly reported to the Board of Director’s Nominating and Governance Committee, ensuring continued progress towards meeting goals of reducing environmental impact and risk exposures across the organization.
U.S. Greenhouse Gas Footprint at a glance
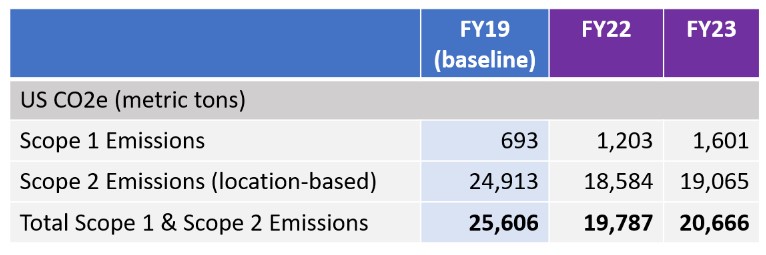
As a provider of business process solutions primarily to government entities, our environmental footprint is comparatively modest. We are resolute in our commitment to reduce this footprint, particularly concerning emissions tied to climate change. Information on our emissions reduction target can be found in our Sustainability Report.